Sleep Trackers Explained: What They Measure and How Accurate They Are
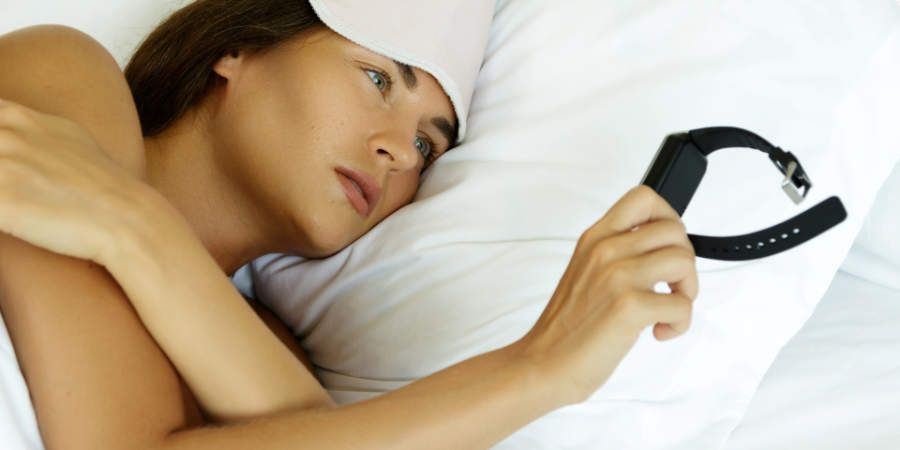
Sleep trackers sit on wrists, slide onto fingers, and rest under mattresses in millions of bedrooms. Each one hands you a score every morning: total sleep time, deep sleep minutes, a readiness number. The numbers look precise. The science behind them is far messier than the app screen suggests.
Written with the assistance of Claude AI, reviewed by the Sleep Well Tips team using peer-reviewed sleep research.
This guide walks through what your tracker measures directly, what it estimates, and how those estimates compare against polysomnography, the lab-grade sleep test doctors use as the reference standard. We pulled figures from four separate validation studies and built a comparison table with a calculation the original researchers did not publish themselves: the accuracy gap between simple sleep detection and detailed stage detection for three popular devices.
What Your Tracker Measures Directly
Every consumer sleep tracker relies on one or more of the following sensors. Each one senses something physical. None of them senses sleep itself.
- Accelerometer: measures movement in three directions. This is the base of actigraphy, the decades-old method sleep researchers used before wearables existed.
- Photoplethysmography (PPG): shines green or infrared light into the skin and measures how much light bounces back as blood moves through capillaries. This is how a tracker gets your heart rate and heart rate variability.
- Skin temperature sensor: measures the surface temperature of your skin, which shifts across the night and across your cycle if you menstruate.
- Pulse oximeter (SpO2): estimates the percentage of oxygen in your blood, using a variation of the same PPG light.
- Microphone or under-mattress pressure sensor: found on nearable and airable devices sitting on a nightstand or sliding under a mattress instead of touching your skin. These pick up sound, vibration, and pressure changes instead of direct biosignals.
None of these sensors record brain waves, eye movement, or muscle tone, the three signals a polysomnography test in a sleep lab records directly. This is the starting limitation behind every accuracy number in this article.empocorp
How Raw Signals Become a Sleep Score
A tracker does not report raw sensor data to you. It runs the numbers through a proprietary algorithm, often built with machine learning, trained on a limited set of test subjects. The algorithm assigns each 30-second block of the night, called an epoch, a label: awake, light sleep, deep sleep, or REM. A nine-hour night produces around 1,080 of these epochs.
Sleep scientists test tracker accuracy by comparing epoch-by-epoch labels against polysomnography, using two main scores. Sensitivity measures how often a tracker correctly flags a state, such as sleep versus wake, out of all the times the state truly occurred. Macro F1 combines precision and recall into a single number between 0 and 1, giving a rounder picture of stage-by-stage performance. Higher is better on both scores.
For a deeper technical walkthrough of one company’s algorithm, the channel The Quantified Scientist tested the Oura Ring’s sleep engine against a research-grade EEG headband and published the results on video.
Detecting Sleep Versus Wake: The Simple Part
Telling sleep from wake is the one job trackers handle well. A 2024 inpatient study comparing the Oura Ring, Fitbit Sense 2, and Apple Watch Series 8 against polysomnography found sensitivity of 95 percent or higher for all three devices on this basic task (Sensors, 2024). A broader review of actigraphy research found similar results, with most devices correctly identifying above 90 percent of sleep epochs (The Conversation, 2026).
The catch sits on the other side of the same coin. Detecting wakefulness while lying still is harder, since trackers read stillness as sleep. The same actigraphy review found wake-detection accuracy ranging from 26 to 73 percent across devices, since a body lying still while reading or scrolling a phone looks identical to a sleeping body from an accelerometer’s point of view.
If your goal for tracking is spotting whether your bedtime and wake time stay consistent, this is the layer of data worth trusting most. For help building a steady schedule, see our guide on fixing your sleeping schedule.
Sleep Stage Accuracy: Where The Numbers Fall Apart
Stage detection asks more of a tracker than yes-or-no sleep detection. A tracker has to distinguish light sleep from deep sleep from REM sleep using only movement, heart rate, and sometimes temperature, none of which map cleanly onto brain activity.
A 2023 multicenter study in JMIR mHealth and uHealth tested 11 consumer devices, including the Apple Watch 8, Oura Ring 3, Fitbit Sense 2, Galaxy Watch 5, and Google Pixel Watch, against polysomnography across 543 hours of lab recordings. Macro F1 scores for sleep stage classification ranged from 0.26 to 0.69 across the 11 devices. No device reached what researchers typically call strong agreement.
A separate single-night study of the Oura Ring, Fitbit Sense 2, and Apple Watch Series 8 in 35 healthy adults reported stage-detection sensitivity of 76.0 to 79.5 percent for Oura, 61.7 to 78.0 percent for Fitbit, and 50.5 to 86.1 percent for Apple (Sensors, 2024).
We combined the numbers from this second study into a comparison the original paper did not run: the gap between each device’s near-perfect sleep/wake sensitivity and its stage-detection sensitivity range.
| Device | Sleep vs Wake Sensitivity | Stage Sensitivity Range | Accuracy Gap (Our Calculation) |
|---|---|---|---|
| Oura Ring 3 | 95%+ | 76.0% to 79.5% | 15 to 19 points |
| Fitbit Sense 2 | 95%+ | 61.7% to 78.0% | 17 to 33 points |
| Apple Watch Series 8 | 95%+ | 50.5% to 86.1% | 9 to 45 points |
Sleep vs wake and stage sensitivity figures come from the 35-participant single-night inpatient study (Sensors, 2024). The accuracy gap column is our own calculation, the spread between each device’s sleep/wake sensitivity and its stage-level sensitivity range, not a figure published in the original paper.
The size of the gap matters as much as the sensitivity number itself. Oura keeps a fairly tight gap, meaning its stage estimates stay close to its overall sleep-detection accuracy night after night. Apple Watch shows the widest swing of the three, with a gap as small as 9 points in its best case and as large as 45 points in its worst. A device with a wide gap feels accurate some nights and off on others, even without any change in your actual sleep.
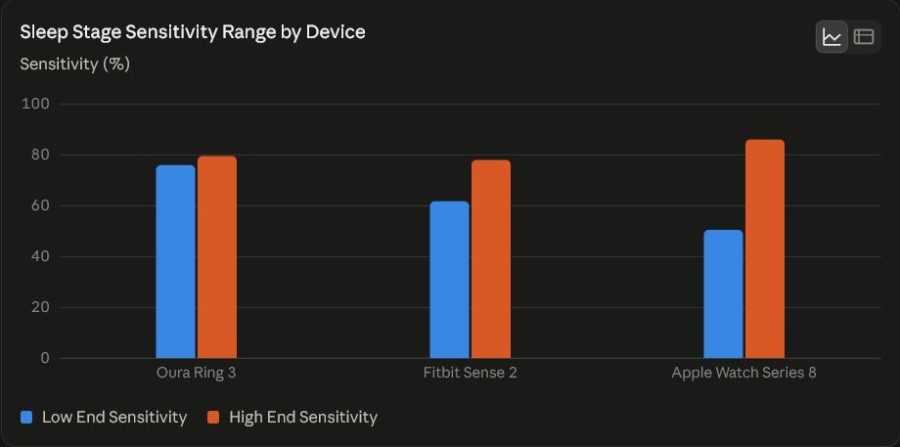
The spread between the low and high bars for each device tells you more about reliability than either single number does. Apple’s tall gap means its stage readings swing hardest between nights.
Apnea Screening Features Are A Different Category
Some trackers go beyond describing your sleep and flag a possible medical condition. Sleep apnea screening uses blood oxygen readings, breathing-disturbance patterns, or both, and it operates under a stricter set of rules than a sleep score.
As of 2026, three consumer wearable features hold FDA clearance for sleep apnea screening: Apple’s Sleep Apnea Notification Feature (Apple Watch Series 9 and later), Samsung’s Sleep Apnea Feature (Galaxy Watch and Galaxy Ring), and the Withings Sleep Analyzer breathing-disturbance tracking, first cleared in 2021.
The clinical trial behind Apple’s clearance, run on 1,448 participants, found a weighted sensitivity of 66.3 percent and specificity of 98.5 percent for detecting moderate to severe sleep apnea (FDA data reported by Pulmonology Advisor, 2024). In plain terms, the feature rarely raises a false alarm, but it also misses roughly a third of the people who have the condition, a trade-off Apple’s own documentation acknowledges.
None of these features diagnose sleep apnea. A positive flag is a reason to talk to a doctor and pursue a proper sleep study, not a diagnosis to act on by itself.
When Tracking Your Sleep Backfires
Sleep researchers gave a name to what happens when tracker data starts running the show instead of informing it. Kelly Baron and colleagues at Rush University Medical Center coined the term orthosomnia in 2017, after treating patients who trusted their tracker’s verdict over their own sense of how they had slept, even when the tracker’s reading conflicted with a lab test (Journal of Clinical Sleep Medicine, 2017).
A 2024 cross-sectional study of 523 adults applied a four-part screening algorithm and found orthosomnia prevalence ranging from 3.0 percent under conservative criteria to 14.0 percent under lenient criteria, with people meeting the criteria reporting more severe insomnia symptoms than non-cases (Brain Sciences, 2024).
The pattern shows up as checking your score before checking in with yourself, feeling anxious about a low number even on a day you feel rested, and adjusting your bedtime around what an app recommends instead of what your body signals. If this pattern sounds familiar, relaxation techniques before bed work better than staring at last night’s readiness score.
A polysomnography test like this remains the reference standard every tracker in this article gets measured against. It records brain waves, eye movement, and muscle tone directly, none of which a wrist-worn device ever touches.
Getting Useful Data Without Overthinking It
None of this means a tracker is worthless. It means the data deserves a specific kind of attention.
- Trust total sleep time and bedtime consistency more than stage breakdowns. These carry the strongest validation across studies.
- Read trends across two to four weeks instead of a single night. One bad night skews the picture far less than a two-week pattern.
- Treat deep sleep and REM percentages as rough estimates, not lab results. Even the best-performing devices in these studies missed the mark by double digits on individual stages.
- Bring a printout or screenshot to your doctor if a tracker flags a breathing issue, instead of treating the alert as a diagnosis.
- Stop checking your score the moment it starts affecting how you feel about a night you remember sleeping well.
For a broader set of habits worth pairing with your tracker data, our guide to sleeping well every night covers the fundamentals no algorithm replaces.
A sleep tracker gives you a rough map of your night, not a lab report. Use it to spot patterns worth acting on, and let a real sleep study settle anything the map alone cannot answer.
Sources
- Accuracy of 11 Wearable, Nearable, and Airable Consumer Sleep Trackers: Prospective Multicenter Validation Study, JMIR mHealth and uHealth, 2023
- Performance of Consumer Wrist-Worn Sleep Tracking Devices Compared to Polysomnography: A Meta-Analysis, Journal of Clinical Sleep Medicine, 2025
- Accuracy of Three Commercial Wearable Devices for Sleep Tracking in Healthy Adults, Sensors, 2024
- Orthosomnia: Are Some Patients Taking the Quantified Self Too Far?, Journal of Clinical Sleep Medicine, 2017
- Prevalence of Orthosomnia in a General Population Sample: A Cross-Sectional Study, Brain Sciences, 2024
- FDA Clears Apple’s Sleep Apnea Notification Feature, Pulmonology Advisor, 2024
- Samsung Announces FDA-Cleared Smart Ring for Sleep Apnea Risk, MobiHealthNews
- Withings Goes Head-to-Head With Apple, Nabbing FDA OK for Smartwatch to Detect AFib, Sleep Apnea, Fierce Biotech, 2021
- How Do Sleep Trackers Work, and Are They Worth It? A Sleep Scientist Breaks It Down, The Conversation
- Past, Present, and Future of Multisensory Wearable Technology to Monitor Sleep and Circadian Rhythms, PMC
- Oura Ring 3 Sleep Tracking: The Science, The Quantified Scientist, YouTube